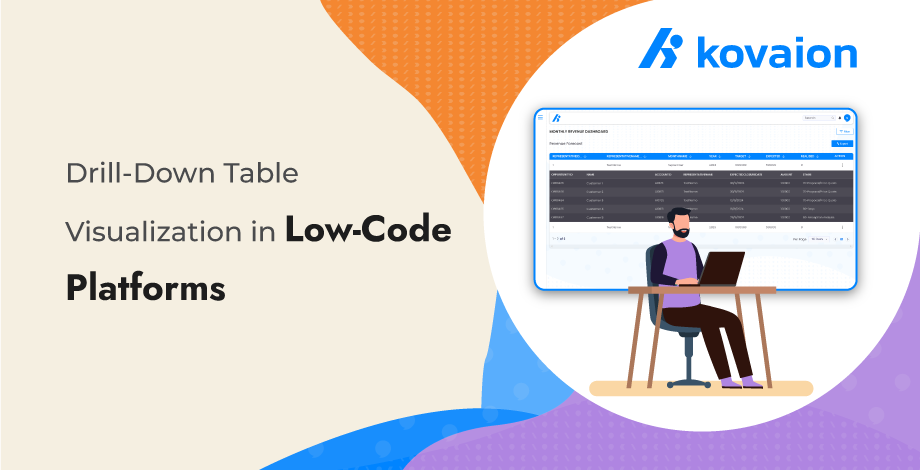
Drill-Down Table Visualization in Low-Code Platforms
How to Implement Click-to-Drill-Down Table Chart for Data Visualization
Data visualization is key in modern analytics and business intelligence. One of the most useful features in data dashboards is the ability to “drill down” into data, offering deeper insights into specific subsets. A click-to-drill-down table chart provides users with an interactive way to explore data, moving from summary-level information to detailed views by simply clicking on the data points. In this blog post, we’ll explore how to design, implement, and use click-to-drill-down table charts effectively.
What is a Click-to-Drill-Down Table Chart?
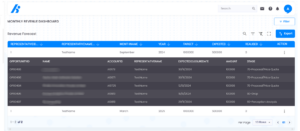
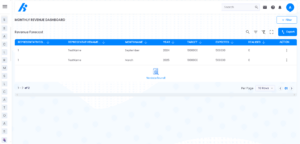
A click-to-drill-down table chart is a powerful interactive feature that allows users to click on a row or data point in a table to reveal more detailed data. For example, if you’re looking at a table showing total sales per country, clicking on a specific country could expand the data to show sales by region, city, or individual stores within that country. The user can drill deeper into layers of data, often moving from a high-level overview to granular details.
A drill-down table allows users to navigate through layers of information in a dataset by clicking on specific data points. Instead of overwhelming users with detailed data at once, a drill-down table first presents high-level summary information. The user can then click on specific rows or items to reveal additional, more detailed data—commonly referred to as “drilling down” into the data.
For example, in a financial dashboard, a drill-down table might show total sales by region. Clicking on a region could reveal sales by city within that region, and clicking further could show sales by individual stores. This way, users can choose how much detail they want to see.
Key Benefits of Drill-Down Features:
- Interactivity: Engages users by allowing them to explore data with clicks instead of overwhelming them with all data at once.
- Layered Insights: Presents high-level summaries initially and only reveals detail on demand, keeping dashboards clean and digestible.
- Flexibility: Users can explore data in the way they want, following their own analysis paths.
- Efficient Decision-Making: Helps users find specific data quickly, streamlining their decision-making process.
How Does Drill-Down Work in Table Charts?
The drill-down functionality can be implemented by linking table rows to subsequent datasets or charts. Here’s an outline of how this interaction might work in a simple case:
- Initial View: The user sees a summary table with high-level data, such as total sales per region or number of orders by product category.
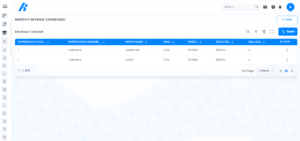
- Click Event: When the user clicks on a row, a click event is triggered. This event is often tied to a backend data fetch or an on-page expansion, revealing a more detailed view.
- Secondary View: After clicking, the table expands to show more granular data related to the selected row. This could be in the form of a new table, a nested table, or an adjacent chart.
- Multiple Layers: Depending on the data, multiple layers of drill-down can be implemented. Users can keep clicking to explore deeper and deeper data.
Designing an Effective Drill-Down Table Chart
Designing a drill-down table chart involves multiple considerations to ensure usability and performance.
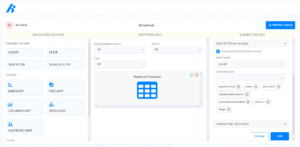
3.1 Structuring Data for Drill-Down
Before implementing the feature, you need to consider how the data will be structured:
- Hierarchical Data: Ensure your dataset is hierarchical, with parent-child relationships. For example, sales data could be grouped by country → state → city → store.
- Database Queries: When the user clicks on a row, the system should fetch the next layer of data. Optimize your backend queries to handle these dynamic requests quickly.
- Pagination: For large datasets, use pagination in both summary and drill-down views to prevent overwhelming the user with too much data at once.
3.2 User Interface (UI) Design
The UI should be intuitive and provide clear indicators that data is drillable:
- Clickable Rows: Rows should change style on hover or display a drill-down icon to indicate that clicking will expand the data.
- Expand/Collapse Icons: Use icons like “+” to indicate expandable data and “-” to show that the data has been expanded.
- Breadcrumbs: Provide breadcrumbs or a hierarchical view above the table so users can see where they are in the drill-down process and navigate back easily.
- Responsiveness: Ensure the drill-down table works well on all device sizes. On mobile, consider collapsing the table into lists or cards to maintain usability.
3.3 Performance Optimization
Drill-down tables can require complex queries, especially when dealing with large datasets. To ensure smooth performance:
- Lazy Loading: Load only the data needed for the current view. When the user clicks to drill down, fetch the additional data at that moment rather than preloading everything.
- Caching: Cache data at each level to prevent unnecessary repeat queries as users navigate back and forth.
- Server-Side Pagination: Implement server-side pagination for large datasets to reduce load times.
Best Practices for Implementing Drill-Down Features
To create an efficient and user-friendly drill-down table, consider these best practices:
4.1 Use Clear Indicators for Drill-Down Availability
Ensure that users can easily identify which rows are drillable. Highlight them with hover effects or icons to encourage interaction.
4.2 Allow Users to Navigate Back Up
Provide breadcrumbs or a “back” button to allow users to easily return to previous levels of data without losing context.
4.3 Prioritize Performance
For large datasets, drill-down functionality can result in heavy database queries. Use lazy loading, caching, and server-side pagination to ensure fast responses.
4.4 Customization Options
Consider allowing users to filter, sort, or customize the displayed columns at each drill-down level. This adds flexibility and helps them focus on the data they care about.
Advantages of Drill-Down Tables
Drill-down tables offer numerous benefits, especially in complex data analysis and business intelligence applications.
5.1. Simplifies Complex Data
One of the primary advantages of a drill-down table is its ability to simplify complex data. Instead of bombarding users with all data at once, a drill-down table starts with a summary view, allowing users to gradually dig deeper based on their interests. This approach keeps dashboards clean, reduces cognitive load, and improves user engagement.
5.2. Enhances User Interactivity
Users can interact with the table by clicking to reveal the data they are most interested in. This hands-on exploration fosters a deeper understanding of the data and encourages discovery of insights that might not be immediately apparent in static reports.
5.3. Focus on Specific Data
With drill-down functionality, users can focus on specific subsets of data without losing the context of the overall dataset. This makes drill-down tables ideal for exploring outliers, anomalies, or trends in the data.
5.4. Scalability
Drill-down tables scale well for large datasets because they load only the required data at each level. This allows users to work with datasets containing thousands or millions of records without performance degradation.
5.5. Supports Decision-Making
By providing users with the ability to dig deeper into the data, drill-down tables facilitate informed decision-making. Users can start with an overview and investigate areas of interest in greater detail to make data-driven decisions.
Best Practices for Designing Drill-Down Tables
To make the most of drill-down tables, it’s important to follow certain best practices during their design and implementation.
6.1. Use Clear Indicators for Drillability
Users should always be aware of where they can click to drill down into more data. Use visual cues such as hover effects, icons, and tooltips to signal that a row is drillable. These cues improve user experience and guide the exploration of the data.
6.2. Provide Contextual Information
Whenever users drill down to the next level, it’s important to show them contextual information about their current view. For example, breadcrumbs or navigation headers can indicate the hierarchy of data, helping users stay oriented as they explore deeper levels of detail.
6.3. Optimize for Performance
Drill-down tables are often used with large datasets, so optimizing performance is crucial. Use lazy loading and server-side pagination to ensure that data loads quickly, especially as users drill down into multiple layers. Additionally, consider caching data where appropriate to minimize the load on your backend.
6.4. Ensure Responsiveness
Drill-down tables should be responsive and work well on all devices, including desktops, tablets, and smartphones. On smaller screens, consider alternative ways of displaying nested data, such as converting tables into collapsible lists or cards.
6.5. Limit the Number of Levels
While multi-level drill-downs are useful, try to limit the number of drill-down levels to prevent overwhelming users. Too many levels can make it difficult for users to navigate or understand the data structure. If your data hierarchy is very deep, provide summary views or visual cues to help users navigate back up efficiently.
6.6. Provide Search and Filter Options
Including search and filter functionality within drill-down tables can improve usability. Users can quickly locate specific data points or filter the data they want to drill down into, speeding up the analysis process.
Common Use Cases for Drill-Down Tables
Drill-down tables are widely used in various industries for analyzing large datasets. Some of the most common use cases include:
7.1. Financial Analysis
Drill-down tables are often used in financial dashboards to analyze sales, expenses, profits, and other metrics. For example, a CFO might start by looking at overall company revenue, then drill down into revenue by department, region, or even individual products.
7.2. Sales and Marketing Reports
Sales teams frequently use drill-down tables to analyze performance by region, salesperson, product category, and customer type. This allows them to identify high-performing products or regions and focus their efforts on improving underperforming areas.
7.3. Inventory Management
In supply chain and inventory management, drill-down tables are used to monitor stock levels across different warehouses or locations. Users can drill down to see stock levels of individual products or product categories within a specific warehouse.
7.4. Website Analytics
Web analytics platforms often use drill-down tables to show traffic sources, user behavior, and engagement data. A marketing team might start by viewing overall website traffic, then drill down to traffic by source (e.g., social media, organic search, paid ads), and further into user behavior (e.g., pages visited, bounce rate).
7.5. Customer Service
Drill-down tables are valuable in customer service reports where support teams can review customer inquiries or complaints at different levels. For example, they might start by viewing total tickets per category, and then drill down into specific tickets and the resolutions provided.
Conclusion
A drill-down table is an invaluable tool for data exploration, offering an interactive way to navigate through large, complex datasets. By presenting high-level summary information and allowing users to “drill down” to more granular details, it simplifies data analysis and provides greater control over how data is viewed and understood. The hierarchical nature of drill-down tables allows organizations to handle vast amounts of data without overwhelming users, while also ensuring that relevant insights are easily accessible.
One of the key strengths of drill-down tables is their interactivity. Rather than static reports that display all the data at once, drill-down tables enable users to explore and focus on specific subsets of the data that are most relevant to them. This enhances the user experience by reducing cognitive load and empowering users to investigate patterns, outliers, or detailed information as needed.
However, successful implementation of drill-down tables requires attention to detail, such as ensuring performance optimization for large datasets, using intuitive design elements like clear clickable indicators, and providing contextual breadcrumbs to help users stay oriented as they drill deeper into the data. Additionally, incorporating search and filter functionalities can improve usability and enhance the overall user experience.
Ultimately, drill-down tables provide a dynamic way to analyze hierarchical data, offering flexibility, scalability, and efficiency. They help users make sense of their data by revealing layers of insights in an organized, visually appealing, and interactive manner. For businesses that need to present large datasets in a digestible format, drill-down tables are a powerful tool that transforms raw data into actionable intelligence.
Author: Anantha Kumar Murugan, Software Engineer